Blog

Correlate Plant Systems by Space on the Digital Twin

Place HVAC, gate IoT, energy, bins, and quality feeds on the same twin so nearby datapoints show how they hit each other - and where the money leaks.

  • Patrik Pasko

  • August 27, 2026

twinzo logistics analytics on a phone
Correlate Plant Systems by Space on the Digital Twin

Dock Gate Left Open, Heaters Still Fighting Winter

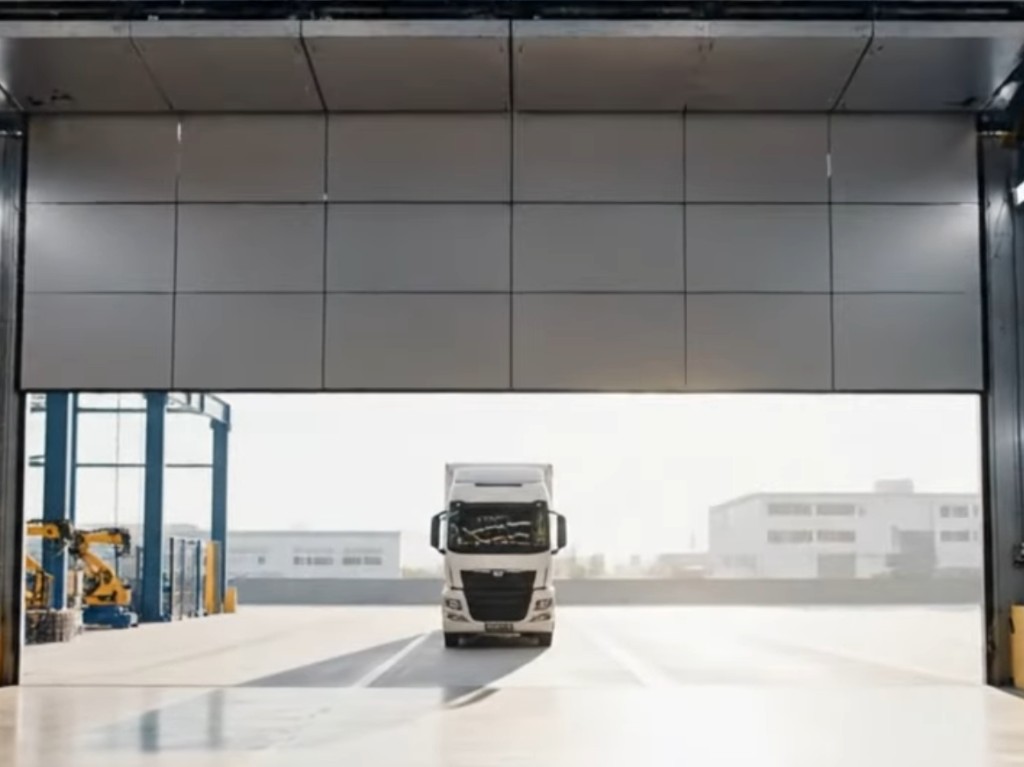
On a January second shift the supplier truck finishes at dock M4-21, the driver pulls clear of the bay, and logistics already has the next ASN on the radio. The overhead door stays up. Cold yard air pours across the threshold while the hall heaters keep pushing heat into a volume that is no longer a closed room. Facilities watches zone temperature fall on a BMS screen that has never heard of a logistic gate. Nobody on either tool is lying. The money leaves in the gap between them: one team owns the door habit, the other owns the energy bill, and neither view shows that the open bay and the fighting HVAC sit a few meters apart.

Warehouse energy practice already treats dock doors as one of the biggest leak paths on site. Open time at loading bays drives heating and cooling load harder than most weekly reports admit, because the gate sensor lives in a logistics or IoT stack and the setpoints live in building management. You heat all winter because somebody forgot to close the gate right after the truck left, and you cool all summer for the same reason. High-speed doors, air curtains, and dock seals exist because plants already know this failure mode. What they still lack is a shared picture where door state and nearby climate data occupy the same hall, so the next open-door hour is visible before it becomes another unexplained spike on the facilities export.

Put both on the twinzo map and the argument changes. Gate open/close becomes an IoT position on M4-21. Exhaust or zone temperature becomes a node a few meters inside the hall. When the door stays open and the neighboring zone keeps climbing in load, dock lead and energy owner are looking at one facility model instead of two CSVs. The waste stops being a debate about whose dashboard is right and becomes a concrete bay that stayed open too long next to equipment that was still trying to hold setpoint.
Open warehouse dock gate with a truck at the bay, cold outside air entering the hall

Same Bay in July: Cooling the Yard Air

July flips the sign on the thermometer without changing the job. The hall is held for process comfort or product limits, an open dock pulls hot humid air across the same threshold, and chillers with AHUs ramp while operators near the bay complain that the air feels sticky and blame 'the AC.' Maintenance trims a setpoint that was never the root cause, because the gate sat open through a long unload and the quiet minutes after the truck left. You are not cooling a closed hall. You are conditioning a strip of yard that happens to sit under your roof line.

A typical afternoon makes the mismatch obvious. Quality calls that packaging near dock 3 is softening in the heat. Facilities opens zone A12 and watches temperature creep. Logistics swears the truck was only there twenty minutes. Replay on the twin shows gate M4-21 open for forty-five, with the HVAC node beside that bay tracking the climb in the same window. That is not a smarter thermostat story. It is two systems finally forced to share space and time, so the soft packaging and the energy ramp point back to an open door instead of a mysterious climate problem.

Spatial correlation does not replace door hardware or unload discipline. It shows when procedure and seals still fail on a given shift, and which nearby sensors prove it, so you stop paying to condition air you never meant to hold. Once the summer pattern sits next to the winter one on the same map, the plant stops treating each season as a new surprise and starts treating open-bay minutes next to conditioned zones as a controllable cost.

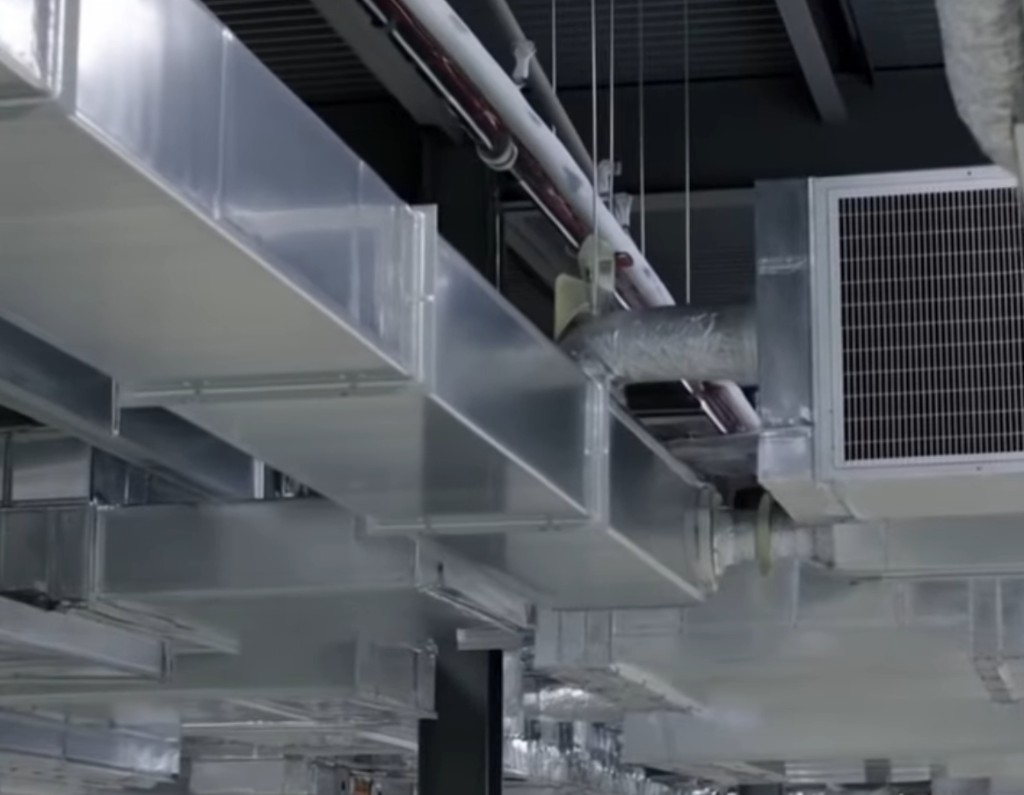
Industrial HVAC ductwork and exhaust units over a plant ceiling

Voltage Imbalance on the Lane, Scrap Up Two Percent

Quality opens the morning scrap report and line 7 is roughly two percent higher on malfunctioning pieces than yesterday. Maintenance pulls the machine log looking for a process drift. Electrical already has a phase imbalance on the feeder that supplies that bay. Each team walks away with a clean story that fits their own screen, and nobody has a shared map that says this energy lane feeds these machines and the imbalance window overlaps the scrap spike. The hunt spreads across the whole hall while the real neighbor relationship sits unused between the meter and the cell.

Industry practice already links voltage unbalance to motor heating, torque ripple, and early failures. NEMA guidance and plant electrical standards treat phase imbalance as something you correct, not something you tolerate until a motor dies. What plants still miss is the spatial join to yield. The meter and the PLC scrap counter rarely live in one view with the machine's floor position, so a two percent scrap bump reads like process noise until you overlay the feeder that was off-spec for that shift. When those positions sit on the twin along the same lane, the morning meeting stops guessing and sends electrical to the bay that actually shares the wire and the scrap.

Place the energy meter or imbalance tag on the twin along the lane, place the machine and its quality feed at the cell, and the correlation becomes something you can point at. Scrap rises while the nearby energy node is off-spec in the same hours, and you do not need three CSV exports stapled into a slide. You fix power first where the map says the feeder and the defective pieces meet, then reopen the process hunt only if the lane is clean.

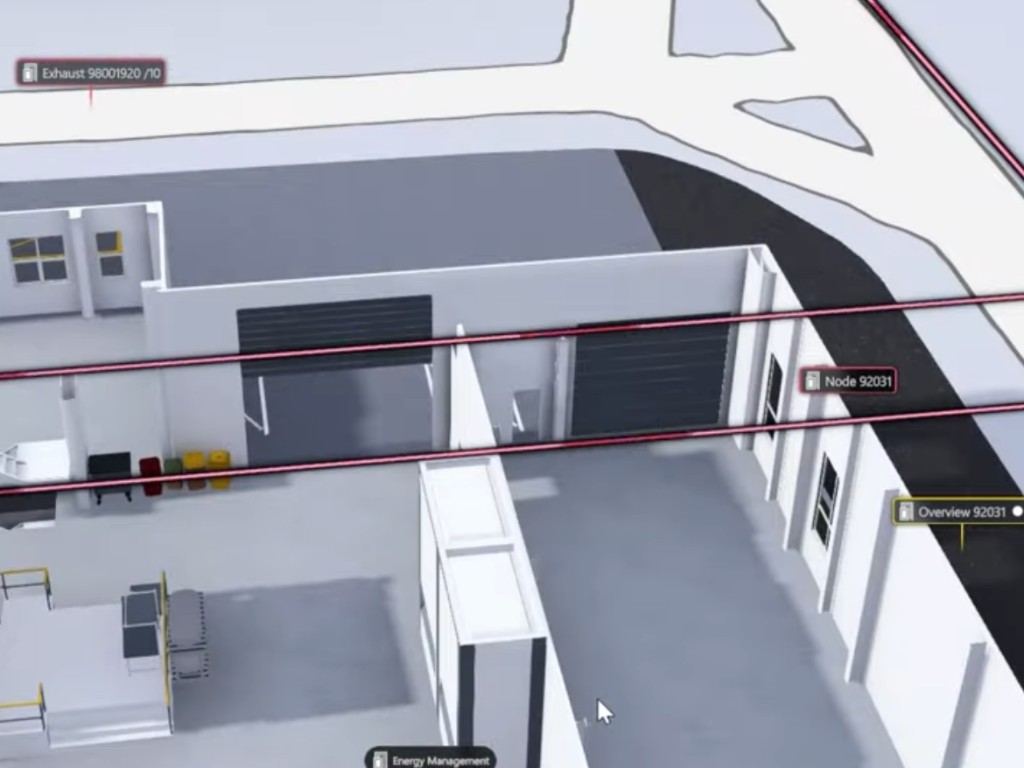
twinzo 3D plant twin with exhaust, energy management, and gate labels on one layout

Smart Bins Full, Forklift Loop Still Empty-Handed

Smart bins already report fill level, and the WMS or waste contract already knows when a pickup should happen, yet intralogistics still runs a fixed forklift or tugger loop that skips a corner because 'that bank never fills.' Then a red bin overflows into an aisle, or a scrap cage creeps into a fire path, and the radio fills with a problem that both systems could have prevented if they had shared a floor. The fill signal lived in one app. The traffic path lived in another. The aisle is where they finally met, too late.

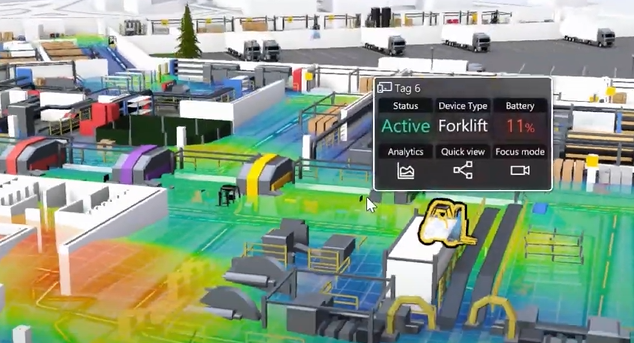
Put the fill sensors on the twin beside the rack or hall they actually occupy, and overlay forklift tracks or the planned loop on the same layout. Area occurrence shows whether drivers visit the bins that are full, or only the empty ones on the habitual outer route. Facilities sees overflow risk while it is still a level on a sensor. Logistics sees that the loop needs a stop at that cluster when fill crosses a threshold, not only when the calendar says it is pickup day.

Night shift leaves two yellow bins near packaging sitting around ninety percent. Morning tugger runs the usual outer loop because that is what the route card says. By mid-morning the aisle is blocked and a pedestrian near-miss report starts working its way up the chain. On the twin those bins had been calling next to a path that never entered the pocket. The fix is not another email asking people to 'please check the bins.' It is a route that reacts when nearby fill is high, because fill and traffic finally share the same map.

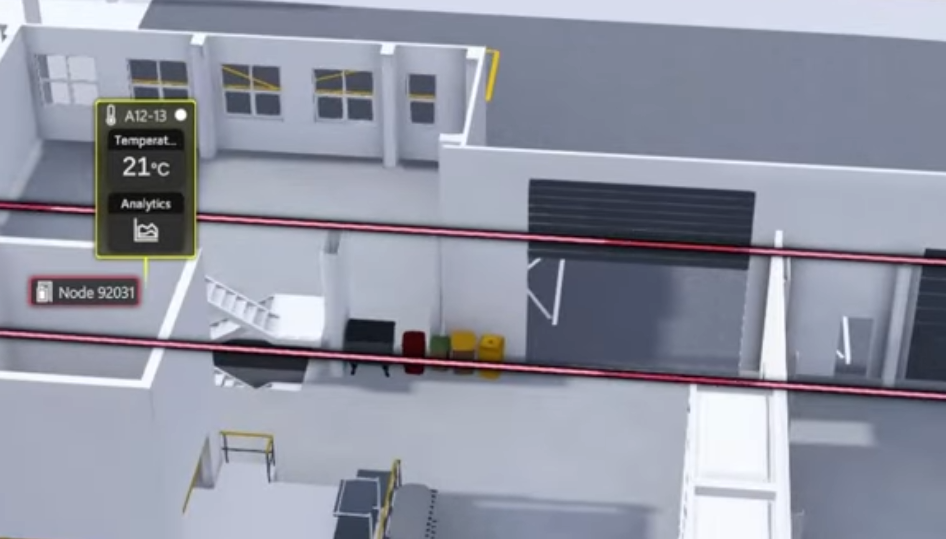
Temperature node A12-13 at 21°C on a twinzo twin near a closed industrial gate and color-coded bins

Energy Spike With No Machine Story

Energy dashboards light up with a peak while production reports OEE as fine and maintenance swears there were no unusual start-ups. The kilowatt-hours still cost money. Often the driver is spatial rather than mechanical: heaters fighting an open bay, compressed-air losses clustered in one hall, or idle equipment left powered in a wing that looks empty on the MES yet still draws on the meter that covers that zone. A plant-wide chart cannot tell you which neighbors misbehaved. A map can.

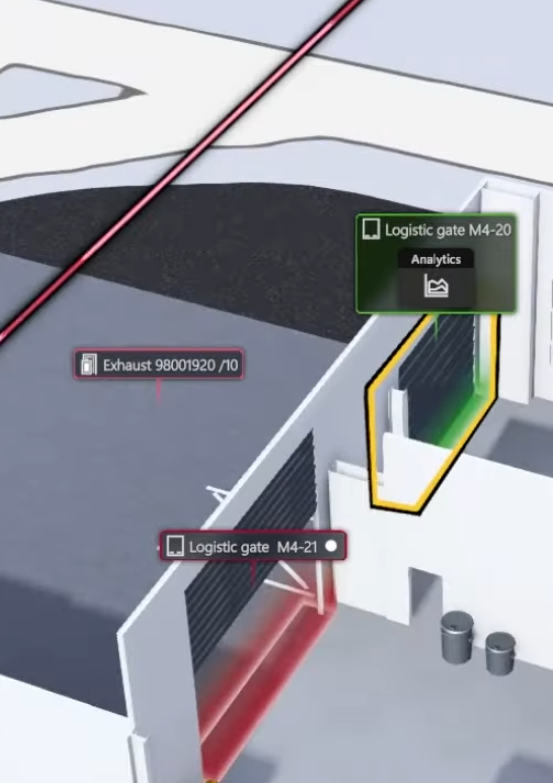
When consumption, HVAC, and gate or occupancy signals sit together on the twin, the question changes from 'why did the plant spike' to 'which nearby positions were abnormal in the same window.' An open logistic gate with a red floor highlight next to a climbing exhaust node is a clearer story than another slide of total kWh. You chase the bay and the setpoint instead of a mystery peak that every department can honestly claim is not theirs.

That is where significant savings actually appear. Not from a slogan about digital twins, but from stopping repeat open-door hours, imbalance windows that trash yield, and routes that ignore full bins until they become incidents. Space is the join key the separate systems never agreed on, and once you use it, the expensive coincidences stop looking like coincidence.

Logistic gates M4-20 and M4-21 highlighted green and red next to exhaust labels on the twin

Place Disconnected Signals on One Floor

Correlation starts when every stream gets an address on the layout people already walk: docks, halls, energy lanes, bin banks, machine cells. You are not inventing a new integration religion. You are giving each datapoint a place on the twin so 'nearby' stops being a metaphor and becomes a distance on a model.

1. Pick the job - open-gate HVAC waste, scrap versus feeder health, bin fill versus routes, unexplained energy peaks.

2. Bring the signals in - gate IoT, HVAC or exhaust tags, meters, imbalance, smart bin fill, quality counters.

3. Place them where they live - bay M4-21, zone A12, feeder on lane 7, bin cluster by packaging.

4. Read neighbors in time - live view first, then replay the shift where money or scrap moved.

twinzo treats those placements like other positions on the plant model. Labels, status colors, and analytics sit on the same 3D hall as forklifts and people when you have them. The point is not prettier icons. The point is that proximity becomes something operators and engineers can see, measure, and argue from without leaving the facility picture.

See Neighbors in 3D, Not in Separate Tabs

A BMS list of zone temperatures and a logistics list of door states will never tell you that door M4-21 sits three meters from node A12-13. On the twin they share walls, floors, and sight lines. Exhaust tags, energy management labels, and gate outlines occupy the same hall, with red and green gate highlights making open versus closed obvious while the HVAC label stays in frame. Operators and engineers walk that model the way they walk the real floor, so an open gate beside a fighting climate node is caught by eye before anyone merges spreadsheets.

That is why space beats another cross-system report. Proximity is the first filter for which datapoints can actually hit each other. Mix the facility model you already have - scan, CAD, or mesh - so the bay and the duct run look like your site. A floating temperature card at 21°C next to a rolling door only helps if that door is the real M4 gate people argue about on the radio, not a generic white box that could belong to any plant.

Replay the Shift Where the Money Left

Catching the correlation live can stop the next hour. Replaying it stops the habit. Pull back the window when energy spiked, scrap jumped, or the hall went cold, and let gate open duration, HVAC load or zone temperature, and any tagged traffic through that bay sit on one timeline over the same map. Area occurrence and dwell work here the same way they work for forklifts and buffers: how long M4-21 stayed open, how long zone A12 sat outside band, whether feeder imbalance overlapped the scrap rise on the machines that draw from that lane.

Bring that replay into the daily ops meeting and the conversation collapses to one facility view instead of three teams defending separate charts. Close the door faster, fix the feeder, change the bin loop. The savings show up when the same failure does not quietly return every winter Monday, because the expensive shift is no longer a story each department tells differently.

Alert When Open Gate Meets Running HVAC

Seeing the correlation once is training. Rules keep it from fading into folklore. Draw the dock as an area on the twin, and if gate state stays open past a dwell threshold while the nearby HVAC zone is still heating or cooling, notify the dock lead and facilities on the same path you already use for no-go entry or other IoT rules. Open during a booked unload is normal. Open for twenty minutes after the truck left with heaters at full is not. The spatial rule is what makes that distinction cheap, because the gate and the HVAC zone have to be neighbors on the map, not merely both 'somewhere in building 2.'

The same pattern extends cleanly. Imbalance on a feeder plus rising scrap on machines in that lane. Bin fill over threshold with no forklift visit in the area for an hour. Energy spike while occupancy in that wing is empty. Each rule is a job someone already owns on the floor, not a generic anomaly badge. Once the neighbors are placed, the alert is just the plant refusing to pay for the same mistake twice.

Who Owns the Fix When Two Systems Clash

Spatial correlation surfaces handoffs that org charts hide. Gate discipline belongs to logistics. HVAC setpoints and seals belong to facilities. Feeder health belongs to electrical. Scrap belongs to quality and production. Bin fill may sit with waste or warehouse. When the twin shows the join, the meeting is about the bay and the lane instead of whose KPI dashboard is 'right.' Give each rule an owner on site: shift lead closes and coaches when a dock stays open too long, facilities and logistics share repeated open-door energy events, electrical goes first on imbalance-plus-scrap, and logistics changes the loop when full bins are ignored rather than only booking a bigger pickup.

KPIs can follow the same map. Open-door minutes next to conditioned zones, energy per bay during unload windows, scrap during off-spec voltage on that feeder, bin overflow events versus visits. Those numbers already exist in pieces across the plant. Space is what turns them into one scoreboard people can manage without translating between five systems every morning.

More Jobs Where Space Is the Join Key

The same pattern shows up anywhere two systems only meet in the hall:

• Compressed air pressure drop near a noisy leak bay - meter and acoustic or flow tags on the twin next to the machines that lose torque.

• Cold-chain buffer next to an open personnel door - product temp and door state share a wall, not two apps.

• AGV charging stalls and fire-exit blocking - occupancy of the stall versus blocked egress path on the layout.

• Welding fume extraction and bay doors - exhaust on while doors dump make-up air the wrong way.

• Water leak sensor under a mezzanine that feeds a process skid - facilities and production see the same pin under the equipment that will stop.

• Lighting and empty halls after shift - occupancy empty, lights still full in that wing on the map.

Put the Next Pair of Signals on One Twin

Start with the leak you already feel on site: open docks versus HVAC, feeder imbalance versus scrap, full bins versus empty loops. Place both on the facility model, watch the neighbors live through one shift, replay the expensive window once, then add a rule so the next open gate does not quietly buy you another winter of heat.

That same spatial correlation pattern shows up when Ignition MES tags or OPC UA feeds via HighByte land on the twin next to logistics positions. Get in touch if you want to walk through this on your own facility model.

You might also be interested in:

GPS Plus Indoor Location: Track Assets From Supplier Yard to Factory Floor

GPS Plus Indoor Location: Track Assets From Supplier Yard to Factory Floor

GPS shows the trailer on the motorway. Inside your hall it goes dark. Combine outdoor GPS with indoor RTLS so the same rack, container, or truck stays on the map from the supplier branch through your gate to the rack.

Read more
How Photogrammetry Builds Plant 3D Models From Photos

How Photogrammetry Builds Plant 3D Models From Photos

When the CAD aisle no longer exists, overlapping photos still can. Here is how feature matching, bundle adjustment, dense stereo, and meshing turn hall, drone, and satellite captures into a scaled twin mesh.

Read more

Landscape mode is not supported, please rotate your device.

By clicking “Accept”, you agree to the storing of cookies on your device to enhance site navigation, analyze site usage, and assist in our marketing efforts. View our Privacy Policy for more information.