Blog

Ask About History, Not the Live RTLS Map

Ask whether a shift lead can replay one order, one truck, or one shift without calling IT. If the answer is a week of data or a CSV export, you bought a nice screen.

  • Patrik Pasko

  • September 29, 2026

twinzo logistics analytics on a phone
Ask About History, Not the Live RTLS Map

Dots Look Great Until Mid-Morning

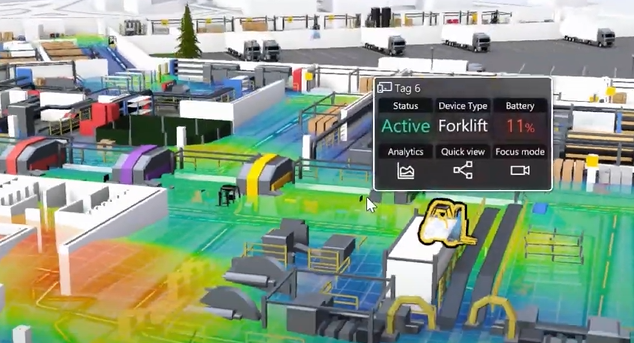
Most RTLS demos sell the live map. Forklift dots glide across the hall on an office screen. The buyer nods. The vendor talks about visibility. By mid-morning on a real shift, nobody is watching that wall. Dispatch is on the radio. The dock is calling for a pallet. The shift lead is walking a late order, not staring at a live feed that updates every second and explains nothing about why yesterday slipped.

‍

That is the usual hangover after go-live. The live picture was the purchase story. The floor still runs on calls and memory when something breaks. Industry practice already treats internal logistics as the last function measured: production has counts, the warehouse has scans, and the path between them stays in chatter. A live map that nobody owns after the demo does not change that. The money is in yesterday, when the miss already happened and the sequence is still reconstructable.

‍

Plant teams that evaluate twins often see demos lead with live 3D maps. The quieter test is whether the same platform keeps a usable record after the dots have moved on. That filter sits next to the no-replacement question in when plant teams evaluate digital twin providers. Live is the showroom. History is the tool.

‍

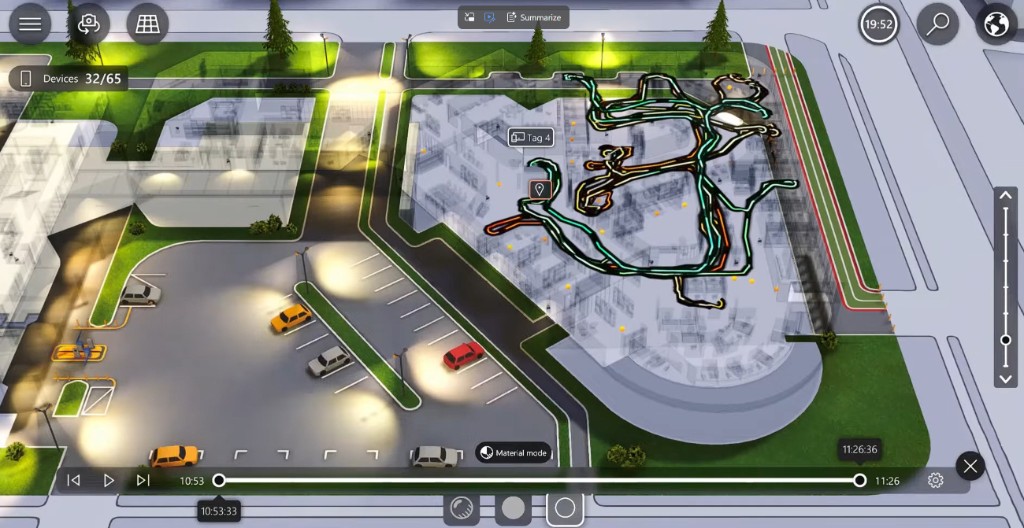
Logistics analysis on a digital twin hall map used for historical review

Late Order, Replay the Crossing

An order shipped late. The ERP shows the timestamp. The WMS shows the last scan. Neither shows why the truck sat with a full load while the appointment burned. Open historical replay on the twin for that window and the hall tells a different story. The outbound truck waited at a shared crossing while inbound traffic kept the intersection blocked. The pallet for that order sat at line end because nobody owned the pickup. Half the fleet drove around empty on loops that never touched the staging face.

‍

That is a typical morning after a miss. Quality or customer service asks what happened. The shift lead remembers a busy dock and a radio pile-up. Without retained positions on the same map, the review ends as opinion. With replay, the crossing wait, the orphan pallet, and the empty loops are visible as paths and zone time, not as blame. Yard and dock ops already treat appointment misses and dwell as cost drivers. When the spatial sequence is missing, those costs stay invisible even though everyone felt the delay.

‍

The live map cannot answer this after the fact. By the time the question reaches the office, the pins have moved. The useful record is the one that can be opened again, stepped through, and examined in the layout people already know. That is the job described in when the event has already passed.

‍

Those You Can Fix

Once the sequence is on the map, the fixes are boring and real. Move the crossing or split the inbound and outbound flows so one truck does not block the other. Give the line-end handover an owner and a call rule so a finished pallet does not wait for whoever happens to drive past. Rebalance the trucks so empty loops stop eating half the fleet while two units carry every urgent call.

‍

None of that needs a prettier live dashboard. It needs evidence the floor accepts. Layout changes, ownership rules, and fleet splits are the levers logistics already knows how to pull. What they lack after a bad day is a shared picture of where time went. Replay turns the late order into a short list of places and behaviors. Then continuous improvement can change the hall instead of rewriting the radio script.

‍

That is where internal logistics optimization earns its keep: not as a live screensaver, but as the archive that supports the next layout and staffing decision. Empty rounds are a known plant tax. Plants keep paying for them when the only proof is a loud driver and a quiet one. Path history ends that argument. See the empty round problem that still sits in most plants.

‍

Can the Shift Lead Replay Without IT?

So ask about history, not the live view. Can a shift lead replay one order, one truck, one shift without calling IT? That is the buying question. Put it in the demo the same way you ask for a coverage map on your floor instead of a lab centimeter claim. If the answer needs a ticket, a data engineer, or a vendor screen share, the tool will not be open when the late shipment call comes in at 06:40.

‍

The right answer looks like this: open the twin, pick the time window, filter the tags that were on that order or in that hall, press play. The same 3D hall used for live tracking shows the past. The lead pauses at the crossing, zooms the buffer, and exports a short clip or report for the morning standup. No CSV gymnastics. No waiting for a BI person who has never walked Dock 3.

‍

twinzo keeps that path on purpose. Live positions feed the twin. The same stream is retained so logistics can open it later. Retention measured in days is not enough for audits and before-and-after layout checks. The useful bar is weeks to a year of positions the floor can still walk through. Match the decision first, then the radio, as in start with the decision, not the technology.

‍

A Week of CSV Is Still a Nice Screen

If the answer is 'we keep a week' or 'export a CSV', you bought a nice screen. A week disappears before the next similar miss shows up. A CSV of timestamps and coordinates is not a hall. The shift lead will not reconstruct a crossing wait from columns at the end of a bad day. That export becomes an IT backlog item, then a forgotten file.

‍

Vendors often treat history as a checkbox behind the live demo. Storage exists. An API exists. The operator path does not. The floor returns to radio because the archive is technically present and operationally absent. Compare that to how plants already run process historians for machine trends: engineers open the chart themselves. Location history needs the same self-serve habit on the twin, not a dump that only a specialist can plot.

‍

Ask three follow-ups in the same meeting. How many months of positions stay online? Who on the plant can open replay without a ticket? Can spaghetti, dwell, and area views run on that same window, or only on live? Soft answers here mean the live map is the product and yesterday is an afterthought.

‍

How to Replay One Bad Window

On the twin, the path from a late order to a fixable picture is short when history is first-class:

‍

1. Name the window - order ship time, appointment slot, or the half-shift when the dock jammed. Bracket a little before and after so waits show up.

2. Pick the movers - the outbound truck, the line-feed forklifts, the tugger on that loop. Leave the rest of the fleet out so the path stays readable.

3. Play on the facility model - same hall layout as live. Pause at crossings, buffers, and docks. Note where motion stops and where empty loops start.

4. Open zone analytics on that window - area occurrence and dwell on the same polygons. Rank which areas ate the time.

5. Decide the fix - layout, ownership, or fleet balance. Re-measure the next similar window after the change.

‍

That loop is what continuous improvement needs. Snapshot lean walks and calendar spaghetti studies miss the day that actually failed. Replay of real travel paths closes that gap. The same idea sits in real travel paths on the floor.

‍

Spaghetti From Yesterday, Not From a Walk

A classic spaghetti diagram is drawn once, by someone following a truck with a clipboard or a tablet, on a day that may not be the day that hurt. Historical replay draws spaghetti from the tagged fleet for the exact window under review. The lines show the empty loops, the backtracks, and the corridors that every driver took while the late order waited.

‍

That difference matters for ROI. Plants do not recover cost from prettier dots. They recover it when empty travel and search time stop. Logistics analysis on the digital twin starts with spaghetti and saturation for that reason. History is what makes those plots honest for the miss you are actually investigating, not for the calm hour when the vendor was on site.

‍

Use spaghetti after replay as the shared artifact in the standup. Point at the crossing cluster. Point at the hall that never received a loaded truck. Then assign the layout or dispatch change. The diagram is evidence, not decoration.

‍

Spaghetti paths of tagged movers on a twinzo facility map

Area Occurrence and Dwell on the Same Window

Paths show how people moved. Areas show where time piled up. Run area occurrence and dwell on the same polygons the plant already named: Dock 3, Buffer B, Crossing A, charge cluster. Occurrence ranks which zones were hit and for how long across the fleet. Dwell shows the long sits that should have been short handovers.

‍

On the late-order window, Crossing A may dominate occurrence while Buffer B shows one long dwell on the orphan pallet. Those are different fixes. One is traffic design. The other is ownership of the line-end pickup. Live area heat during a demo cannot replace that ranked view for the day that failed. The analytics stack on twinzo is built so the same areas feed live rules and historical review. You are not maintaining two zone systems.

‍

Congestion corners and charge clusters show up here too. Industry halls already know trucks idle under mezzanines and at shared intersections. Area history makes that measurable per shift instead of 'it always feels busy there.' Tie the numbers back to the order, not to a monthly average that washes out the miss.

‍

Fleet Saturation Across the Shift

Fleet saturation is the other history view that live glances miss. Two trucks run hot. Two wait for radio. Overtime and rental quotes follow the loud units. Replay plus utilization across the tagged fleet shows the spread. Half the fleet driving empty while the other half carries every call is a balance problem, not a buy-more-steel problem.

‍

WMS move counts will not show that. Completes hide empty travel and waiting between jobs. Location history fills the minutes between scans. Rebalance lanes, radio groups, or kit routes first. Add trucks only when an honest peak window shows similar utilization across the fleet and the hall still misses supply. The longer write-up is in balancing forklift fleet saturation.

‍

Put saturation next to the late-order replay in the same review. The orphan pallet often sat because the hot trucks were stuck in another hall. The empty half of the fleet was available and never called. That is one meeting, one twin, one archive.

‍

See History Playback on the Twin

The live map is easy to demo. Historical replay is easier to skip. Watch a full playback on the facility model so the difference is concrete: same hall, clock set to the past, movers stepping through the window that actually failed.

‍

Use the clip in the vendor meeting. Pause it and ask whether your shift lead can do the same tomorrow morning without IT. If the answer is only the live loop on the phone mockup, keep asking about retention and operator access.

‍

Same Test on Adjacent Jobs

History beats live-only in more than outbound shipping:

‍

• Near-miss after the shift - safety needs the minutes around the event when the live pins have already moved. Replay on the twin beats camera hunting across halls.

• Layout before and after - compare spaghetti and area occurrence on the same polygons after you move a crossing. Calendar walks rarely catch the next peak day.

• Night versus day saturation - roster looks full. Map shows a cold night fleet. Rank movers from history before you add overtime rules.

• Supplier visit without a tag - place the truck, reconstruct the path later if needed. See add assets without live tracking for untracked visits on the same twin.

• Fit-for-purpose accuracy pockets - zone-level history still supports spaghetti and dwell. Bay-level only where the job needs it. The coverage map argument is in ask for a coverage map, not 30 cm on the slide.

‍

Buy the Archive, Not Only the Dots

Live RTLS is useful for 'where is the truck now.' The purchase that changes the floor is the archive a shift lead can open when an order ships late: one window, one set of movers, same hall, no IT ticket. Move the crossing, own the handover, rebalance the fleet. Those fixes come from yesterday, not from a demo loop of dots.

‍

Ask for history in the next evaluation. Check retention length, operator access, and whether spaghetti, area occurrence, dwell, and saturation run on the same retained stream. Related product depth sits under twinzo features and getting started with RTLS.

‍

Get in touch if you want to walk a late-order replay on your own facility model and mark the windows your shift leads would open first.

‍

You might also be interested in:

No previous posts
Back to all posts
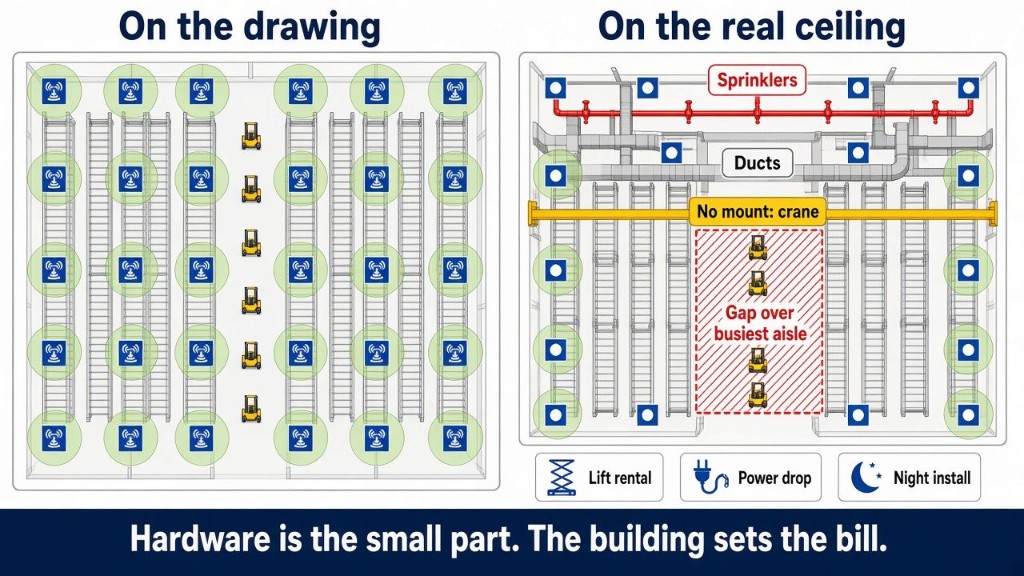
Hardware Is the Small Part. The Building Sets the Bill

Hardware Is the Small Part. The Building Sets the Bill

Most RTLS quotes get compared on price per anchor and datasheet accuracy. In an old plant the lift rental, power drops, and crane rails decide where anchors go, and that decides coverage.

Landscape mode is not supported, please rotate your device.

By clicking “Accept”, you agree to the storing of cookies on your device to enhance site navigation, analyze site usage, and assist in our marketing efforts. View our Privacy Policy for more information.